
eCommerce Customer Acquisition Research
Project Overview
This research project was launched to gain a better understanding of the target customer segments for the digital commerce space in support of our eShop new customer acquisition objectives for 2022.
Project Lead / UX Researcher
ROLE
2022
YEAR
Userlytics, Excel
TOOLS
For portfolio purposes, I’m showcasing primarily how I go about my research projects and how I organize my research & data analytics
PORTFOLIO BRIEF
Project Scope & Research
Research Objectives
Validate existing assumptions around which customers are most likely to purchase from us online / via ecommerce
Validate the right target customers/segments
What (if any) pain points or opportunities exist for these target customers in being able to purchase from a supplier (via e-commerce)
What existing points of friction currently exist in our online shopping flow that needs to be optimized for the user experience
Timeline
WEEK 1
Define scope & target participant profiles. Hold recruitment kick-off call
WEEK 2 & 3
Run recruitment & review profiles. Design research study
WEEK 4
Conduct user interviews & usability tests
WEEK 5
Synthesize findings
WEEK 6
Hold report out
Methodology
Participant Profiles
I identified 2 major segments of target profiles from previous purchase profiles in the back end of our platform. Each of those major segments could be broken down into two minor segments. I decided on 2 profiles per segment, coming to 8 total profiles.
The participant profiles were sourced through AlphaSights and filtered through screener questions I created to target these profiles
Testing Format All testing was performed on Userlytics
30 Minute User Interview
30 Minute Usability Test
All questions were scripted beforehand and designed to dive deeper conversationally into the participant’s experience with online purchasing for their organization
Participants were asked to perform a total of 4 activities designed to take the user through various ports of the website. Those activities targeted actions pertaining to checkout, product exploration through 2 paths, and account registration
Usability test used metrics such as Task success, SEQ, Time on Task, SUS, and 5-point Likert Scale
Synthesizing Findings
Quantitative Findings
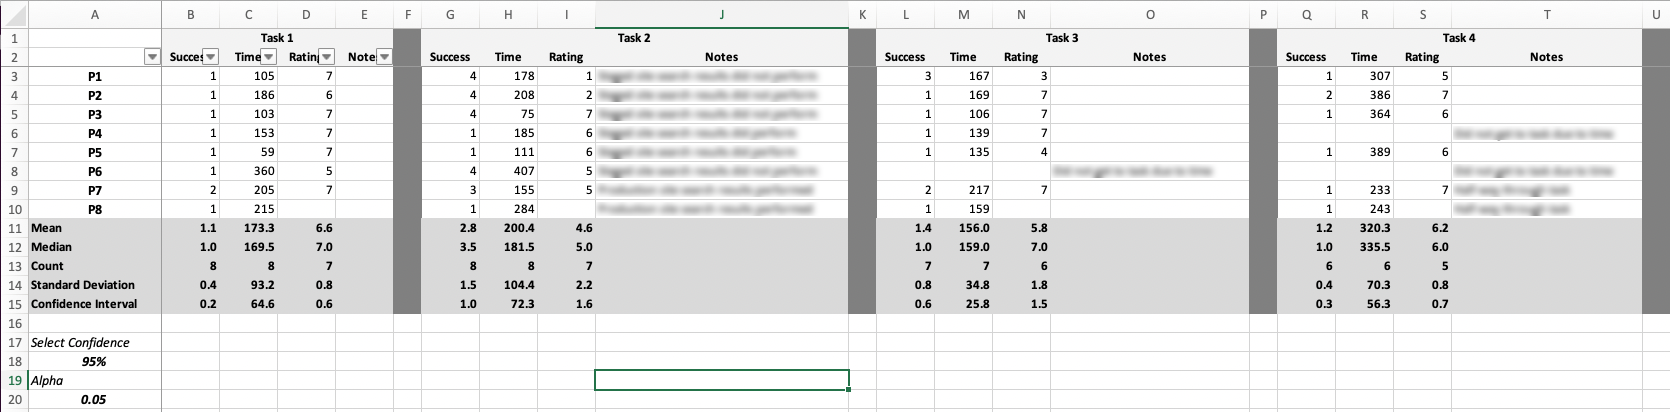
Task Success / SEQ Ratings / Time on Task
Each task given was measured by time on task, and task success rate, as well as followed by an SEQ rating on how difficult the participant found the task to be. All data was compiled raw then organized and equated using excel. The data includes standard deviations and confidence intervals
SUS / Likert Scale Shopping Experience
Among the usability test questions, I included a System Usability Score (SUS) as well as a 5-Point Likert Scale pertaining to their shopping experience. All data was compiled into graphs including the standard deviations and confidence intervals
Task Difficulty
Task difficulty was also taken into account. As the moderator, I took note of how difficult the task was to complete for each user. That way, although a user may have successfully completed a task - it may not have been a straightforward approach
Qualitative Findings
All qualitative observations were compiled in a document with each observer’s name. Each observation was then coded in highlighting the severity and kind of observation while going through each task as well as the User Interview portion.
I’m not including this as it contains the participants names but it is a 33-page document containing their comments, notes, and observations.
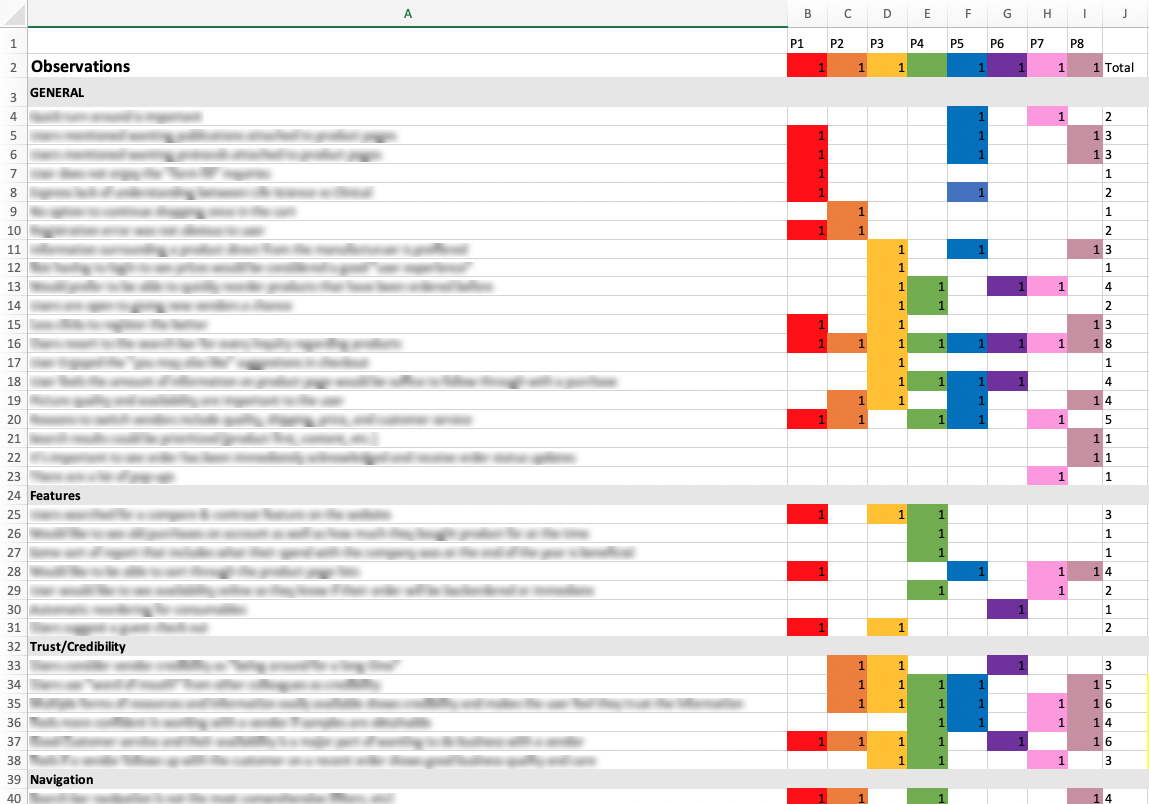
Observations
Observations were then compiled into an excel file rainbow chart keeping track of how many users shared the same experience. They are organized by themes that were deducted
Quotes
Quotes were also extracted and taken note of for more concise user perspectives and references that can be later referred to when validating. They are organized by themes, participants, and notes for context behind the quote
We have all this pretty data compiled.. now what?
This is my favorite part
So I did the research, conducted interviews, and tests, and compiled the data. Now how do we deduce what parts of the data are important for moving forward?
I compiled all the “found issues” from the qualitative and quantitative data within an issue severity table I created and coded in excel.
Each issue is written out and numbered - as well identified by the task it was found in and the description of what happened. Then scored by Criticality, Impact, and Frequency. These are explained further below.
Task Criticality
Rated in terms of impact on the business or the user if the task is not accomplished
Impact Score
Rated in terms of how high the interference of the issue on the experience
Frequency Score
The sum of issue occurrences within participants (P1+P2+P3)/total
Severity Score
Task Criticality x Impact x Frequency
The severity can then be sorted from most severe to lowest to address the most severe issues first. The goal of this is to show stakeholders what our most prominent issues within the platform our and what should be addressed first going forward in order to improve the user experience.
Ok. Now we have severity scores on the issues. How do we solve these issues?
Hint: Another table
Issue Severity Table
The solutions table is similar to the severity table as it gives organization and ranking to the proposed solutions. The solutions table is created by proposing multiple solutions per issue ID - hopefully addressing multiple issues at the same time for efficiency. The table is organized as such:
Solutions Table
Solutions ID
Solution
Issue Solution Effectiveness (Strength of solution rated 1,2,3,5)
Impact Score (Sum of effectiveness strength x Sum of all issue severities - calculated from the previous table)
Complexity (Effort & Uncertainty Score, rated in sprint points)
ROI (Return on Investment, Complexity/Impact)
Next Steps (UX Project? Dev Bug? Customer Service Issue?)
JIRA Key (DEV key for reference)
The solutions can then be organized by their ROI and decided on what solution to implement first. Because they are based on the effectiveness of the solution along with the severity table ratings, we are able to define the next steps as an organization.
Final Step
Once I finished the research and compiled the data, I will hold a report out to the stakeholders regarding my findings, allocating the issues and solutions that have been provided to the team members and highlighting any key findings that are crucial for success. From there, I work on projects that have come about from these findings and validate those solutions once they have been completed.