Designing a Real-Time Trading Analytics Dashboard MVP
Designing a Real-Time Trading Analytics Dashboard MVP
I led UX discovery and design for QuantKhan's trading analytics MVP, interviewing traders and stakeholders to understand their workflows, analytics needs, and priorities for the initial product.
I translated those findings into MVP requirements and designed the dashboard experience, defining how traders could filter, monitor, and investigate live and historical trading performance.
01 / THE CHALLENGE
The Challenge
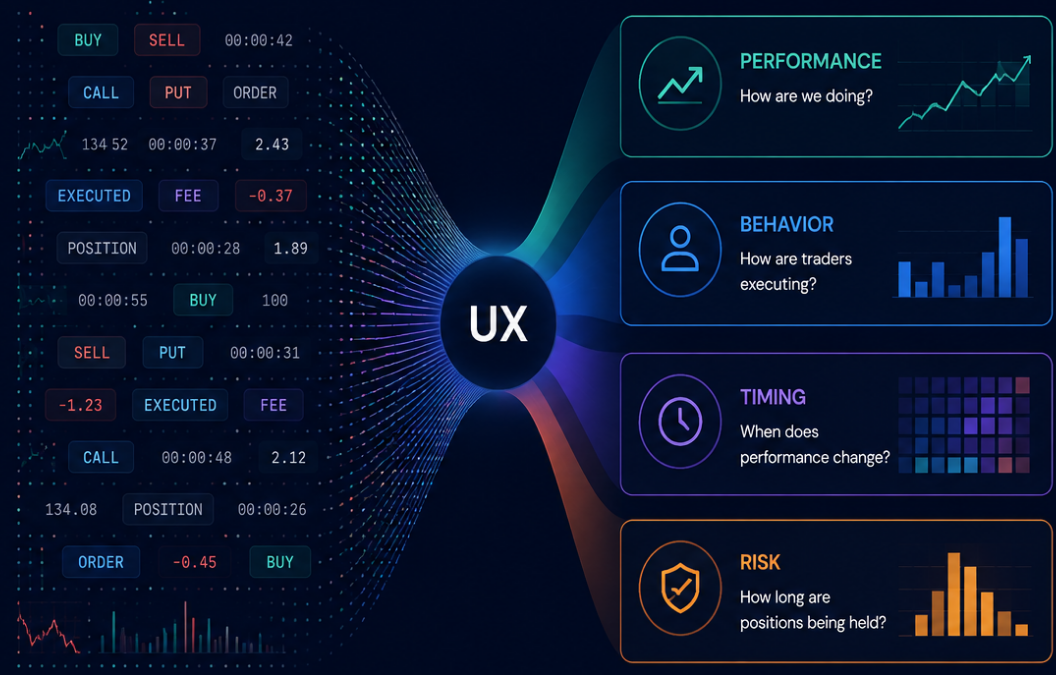
QuantKhan generated large amounts of trading data, but raw execution data alone couldn't easily explain why a trader or strategy was performing well—or where performance was breaking down.
Traders needed a way to move between live activity and historical performance, filter results across different dimensions, and investigate factors such as profit and loss, position duration, commissions, and individual trading behavior.
The challenge was turning complex, rapidly changing data into an MVP that made performance easier to monitor, investigate, and understand.
THE UX QUESTION
How might we transform raw trading data into actionable insights without overwhelming traders with information?
02 / UNDERSTANDING WHAT TRADERS NEEDED
Understanding What Traders Needed
I worked directly with traders and stakeholders to understand what information they needed to monitor performance in the moment and investigate behavior over time.
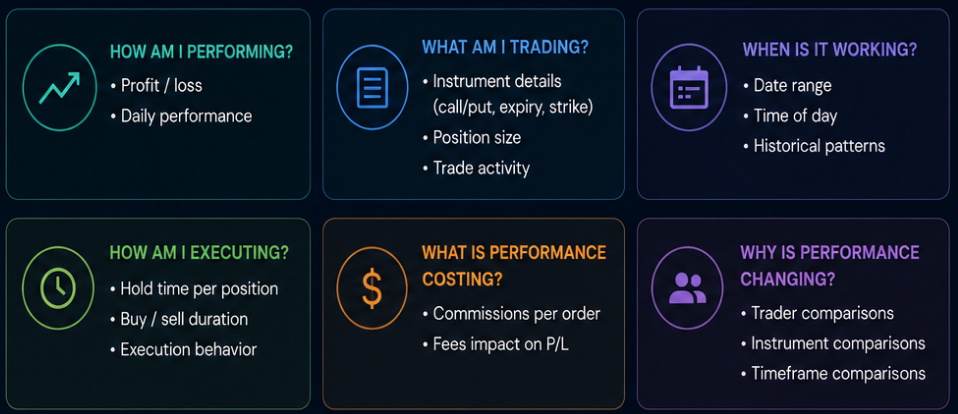
The research revealed that performance alone wasn't enough. Traders needed to understand the context behind the numbers: who was trading, what they were trading, when activity occurred, how long positions were held, and how factors such as commissions affected overall performance.
These needs became the foundation for the MVP's information architecture, filtering system, and analytics.
THE KEY INSIGHT
Don't just show whether performance changed—give traders the tools to investigate why.
03 / DESIGNING THE ANALYTICS EXPERIENCE
Designing the Analytics Experience
I translated the traders' needs into a dashboard structured around three core behaviors: filtering the data, monitoring current activity, and investigating performance over time.
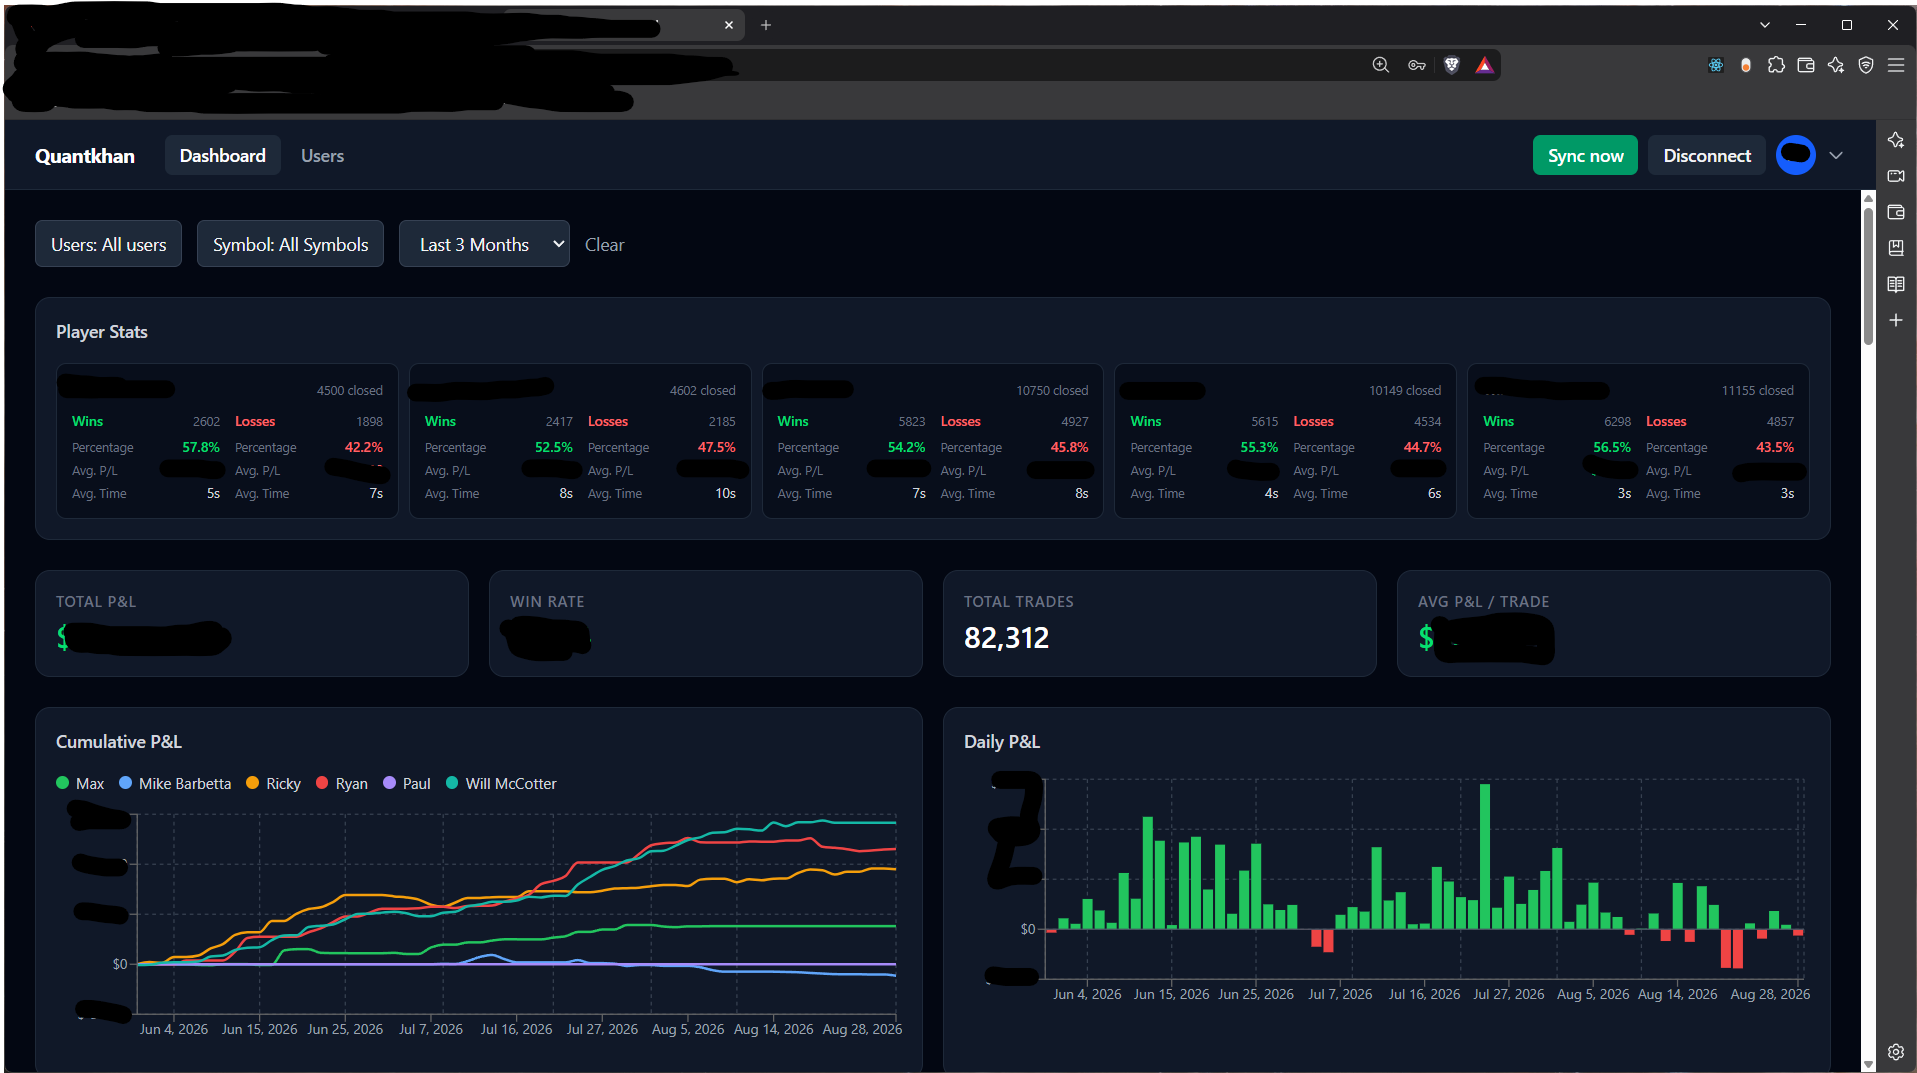
The experience allowed users to move from a high-level view of performance into more specific questions by filtering across traders, instruments, and timeframes. Live views surfaced current trading activity, while historical analytics helped users investigate patterns in profit and loss, hold time, commissions, and strategy performance.
For the MVP, the priority was clarity and speed, surfacing the information traders needed most while creating a structure that could expand as additional market data became available.
DESIGN PRINCIPLE
Start with the decision a trader needs to make, then surface the data needed to support it.
04 / DESIGNING WITH MVP CONSTRAINTS
Designing with MVP Constraints
The first iteration needed to deliver useful insights quickly without waiting for a production-grade data infrastructure.
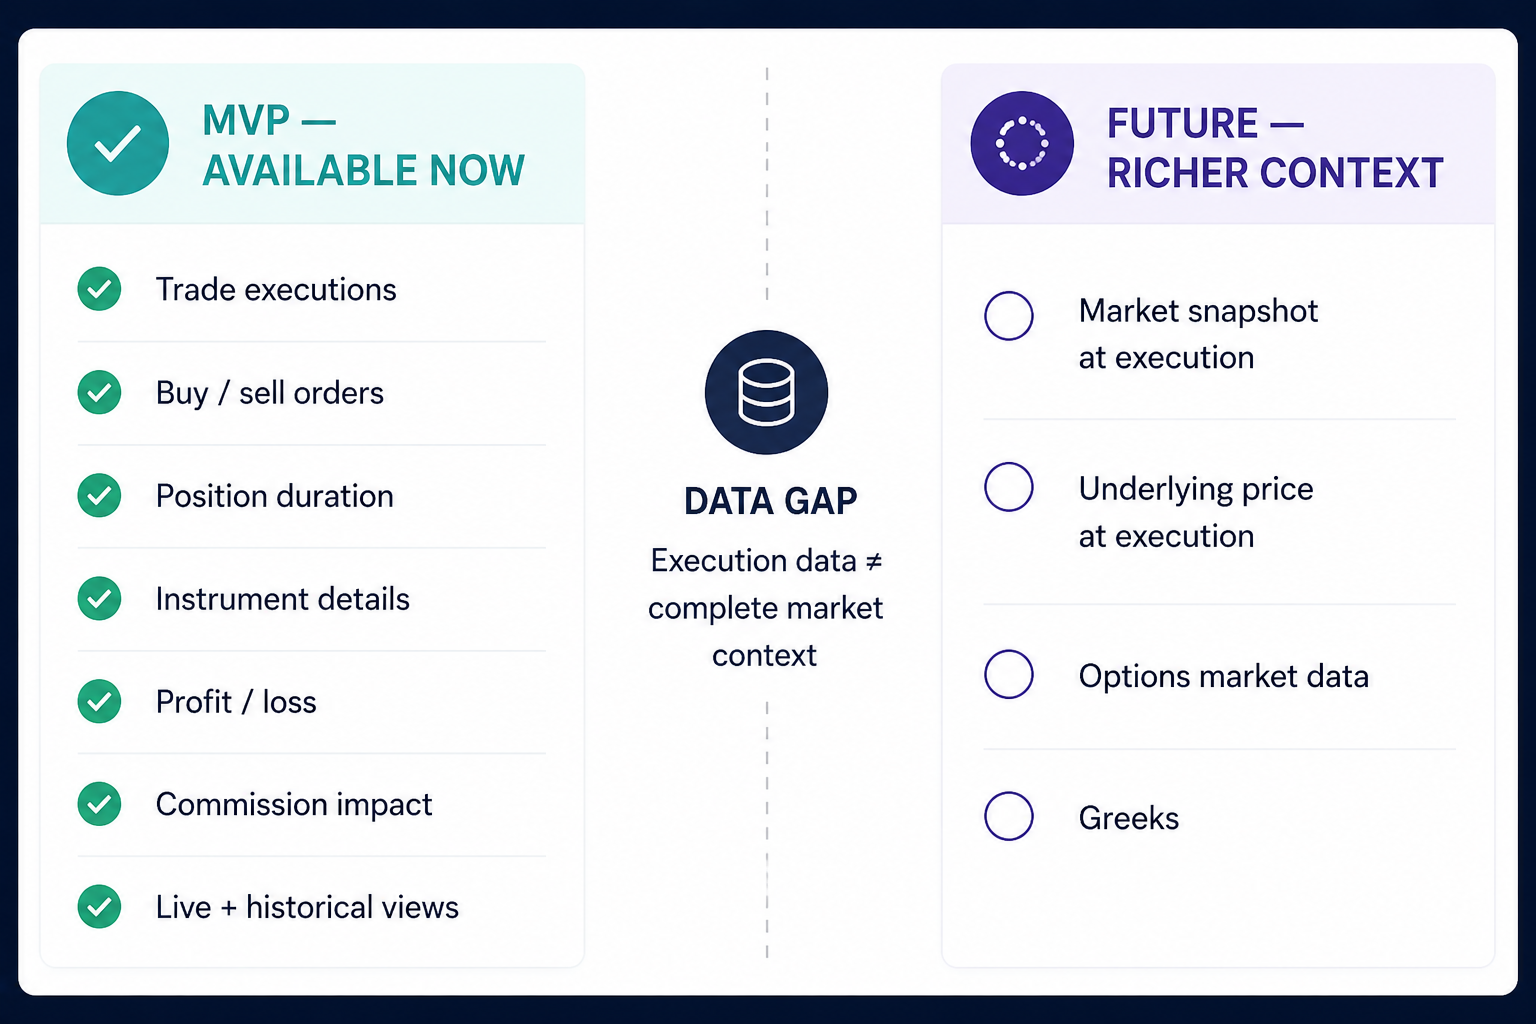
The MVP connected to individual trader execution data and periodically pulled new information into the dashboard. This gave us enough data to analyze trades, position duration, commissions, and performance but it didn't capture the broader market conditions at the exact moment a trade was executed.
Rather than designing around data we didn't have, I structured the MVP around what was reliably available while leaving room for richer analytics as the data infrastructure evolved.
THE TRADEOFF
Deliver meaningful analytics now → create room for deeper market context later.
05 / MVP OUTCOME & NEXT STEPS
MVP Outcome & Next Steps
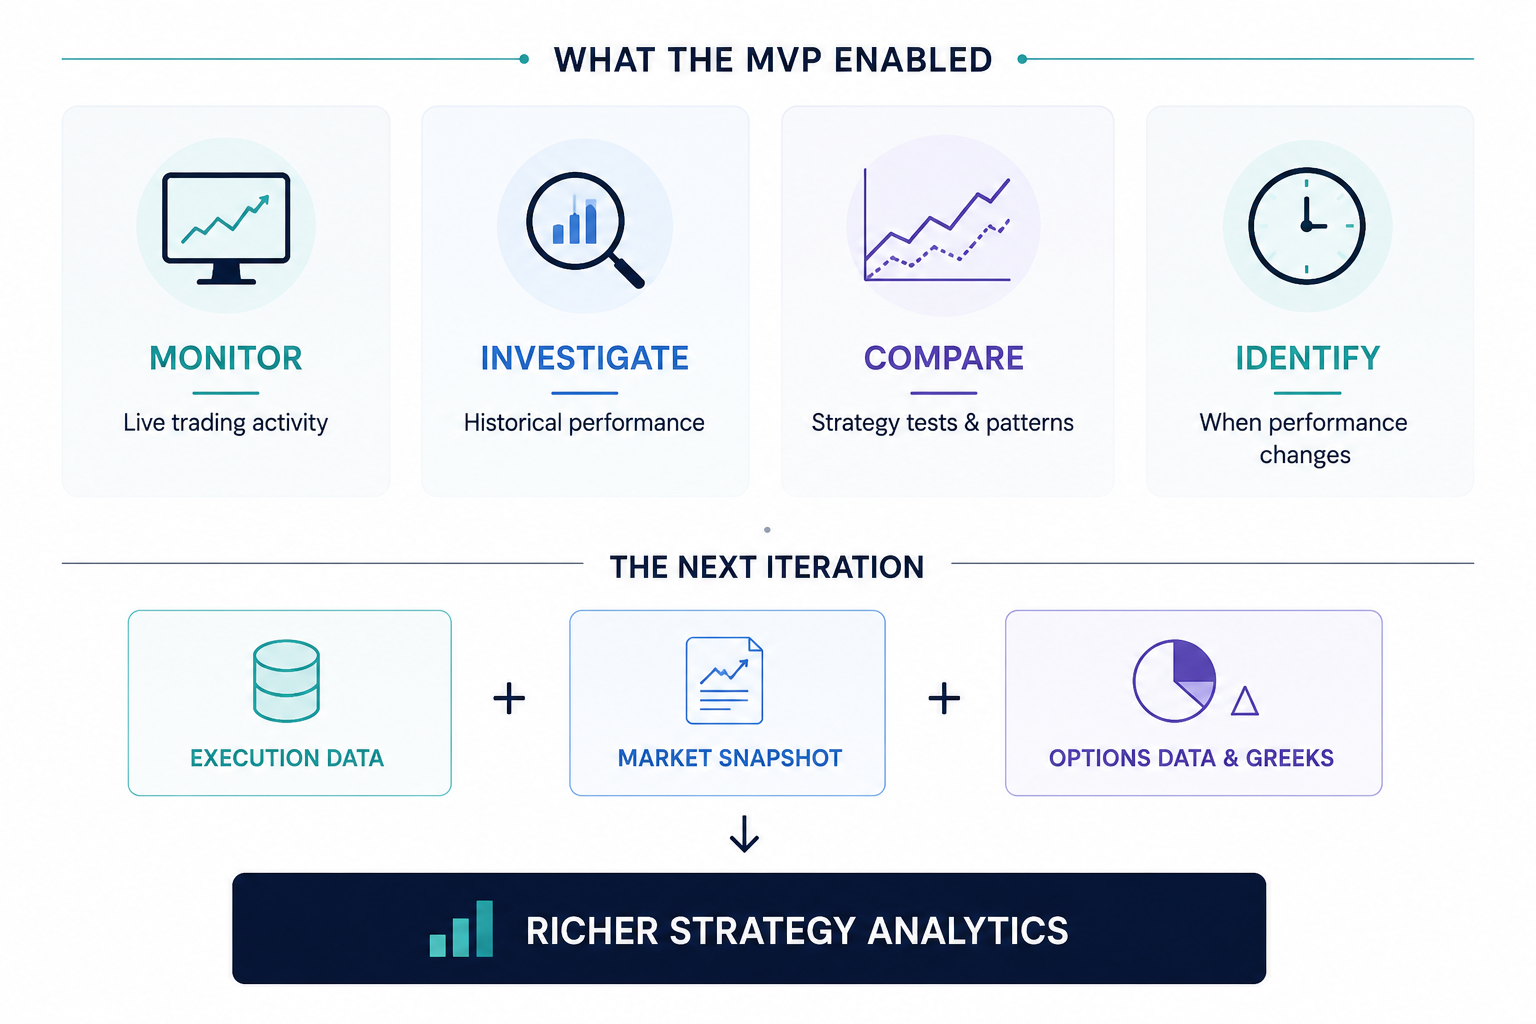
The MVP gave traders and stakeholders a clearer way to monitor live performance and investigate historical trading behavior.
By bringing execution data, performance, hold time, commissions, and filtering into one experience, the dashboard helped surface patterns that were difficult to identify from raw trading data alone, including differences in strategy performance across times of day and how different tests performed compared with control conditions.
The first iteration also clarified what the product needed next: richer market context captured alongside execution data.
THE OUTCOME
A functional analytics MVP that turned trading data into a foundation for ongoing strategy analysis and product iteration.
ROLE
Lead UX Designer/Researcher, Information Architect
PRODUCT
Trading Analytics MVP
TIMELINE
2-4 Weeks
METHODS
User interviews, Requirements Discovery & Definition, Information Architecture, Dashboard Design, Usability Testing